How can I use the Due Diligence Score to save myself hours of painful fundamental analysis?
 Updated
by Lincoln Olson
Note: The Zen Score is now the Due Diligence Score. Our new primary ratings model is Zen Ratings. Click here to learn more about Zen Ratings.
As a busy, part-time investor, you know how hard it is to decide which models, formulas, and ratios you should be using in your fundamental analysis.
Plus, even after you have your system down, the whole process is tedious, time-consuming, and just flat-out not fun.
At least, that was my experience.
After spending weeks of my life performing essentially the same analysis on company after company, I realized I could build a tool in Excel that could pull data in and do most of the legwork for me.
A few iterations and a new website later: the Due Diligence Score (formerly Zen Score).
Hours of manual research, completed for you in seconds.
If you're a visual learner, here's the video walkthrough:
If you're a learner by reading, here's the highlight reel to get you started:
Due Diligence Score: What it is and how it's calculated?
Our Due Diligence Score can help you understand the fundamental strengths and weaknesses of a stock in minutes. We've automated some of the most common and time-tested due diligence checks used in fundamental analysis, so you can use the score as a gauge for a stock’s current, holistic fundamental condition.
It’s not a forecast or prediction, the Due Diligence Score is a snapshot in time of how a stock stands right now based on its fundamentals. Based on the total score and the score breakdown, you can decide right then if the stock is a buy or sell, or decide to launch further investigation into whatever areas you want to know more about.
For more information on our Due Diligence Score, click here.
Breaking it down:
We run 38 total due diligence checks on stock fundamentals across 5 dimensions, which are then averaged together to create the Total Score.
The 5 dimensions we run checks on are:
- Valuation (7 checks)
- Financials (7 checks)
- Forecast (9 checks)
- Performance (10 checks)
- Dividend (5 checks)
You can think of the Due Diligence Score like a standardized test you took in school: You may have completed different sections like math, english, reading & comprehension, history, and science, which are scored individually and averaged together for your total composite score.
The higher the score, the better.
How the dimensions relate to one another
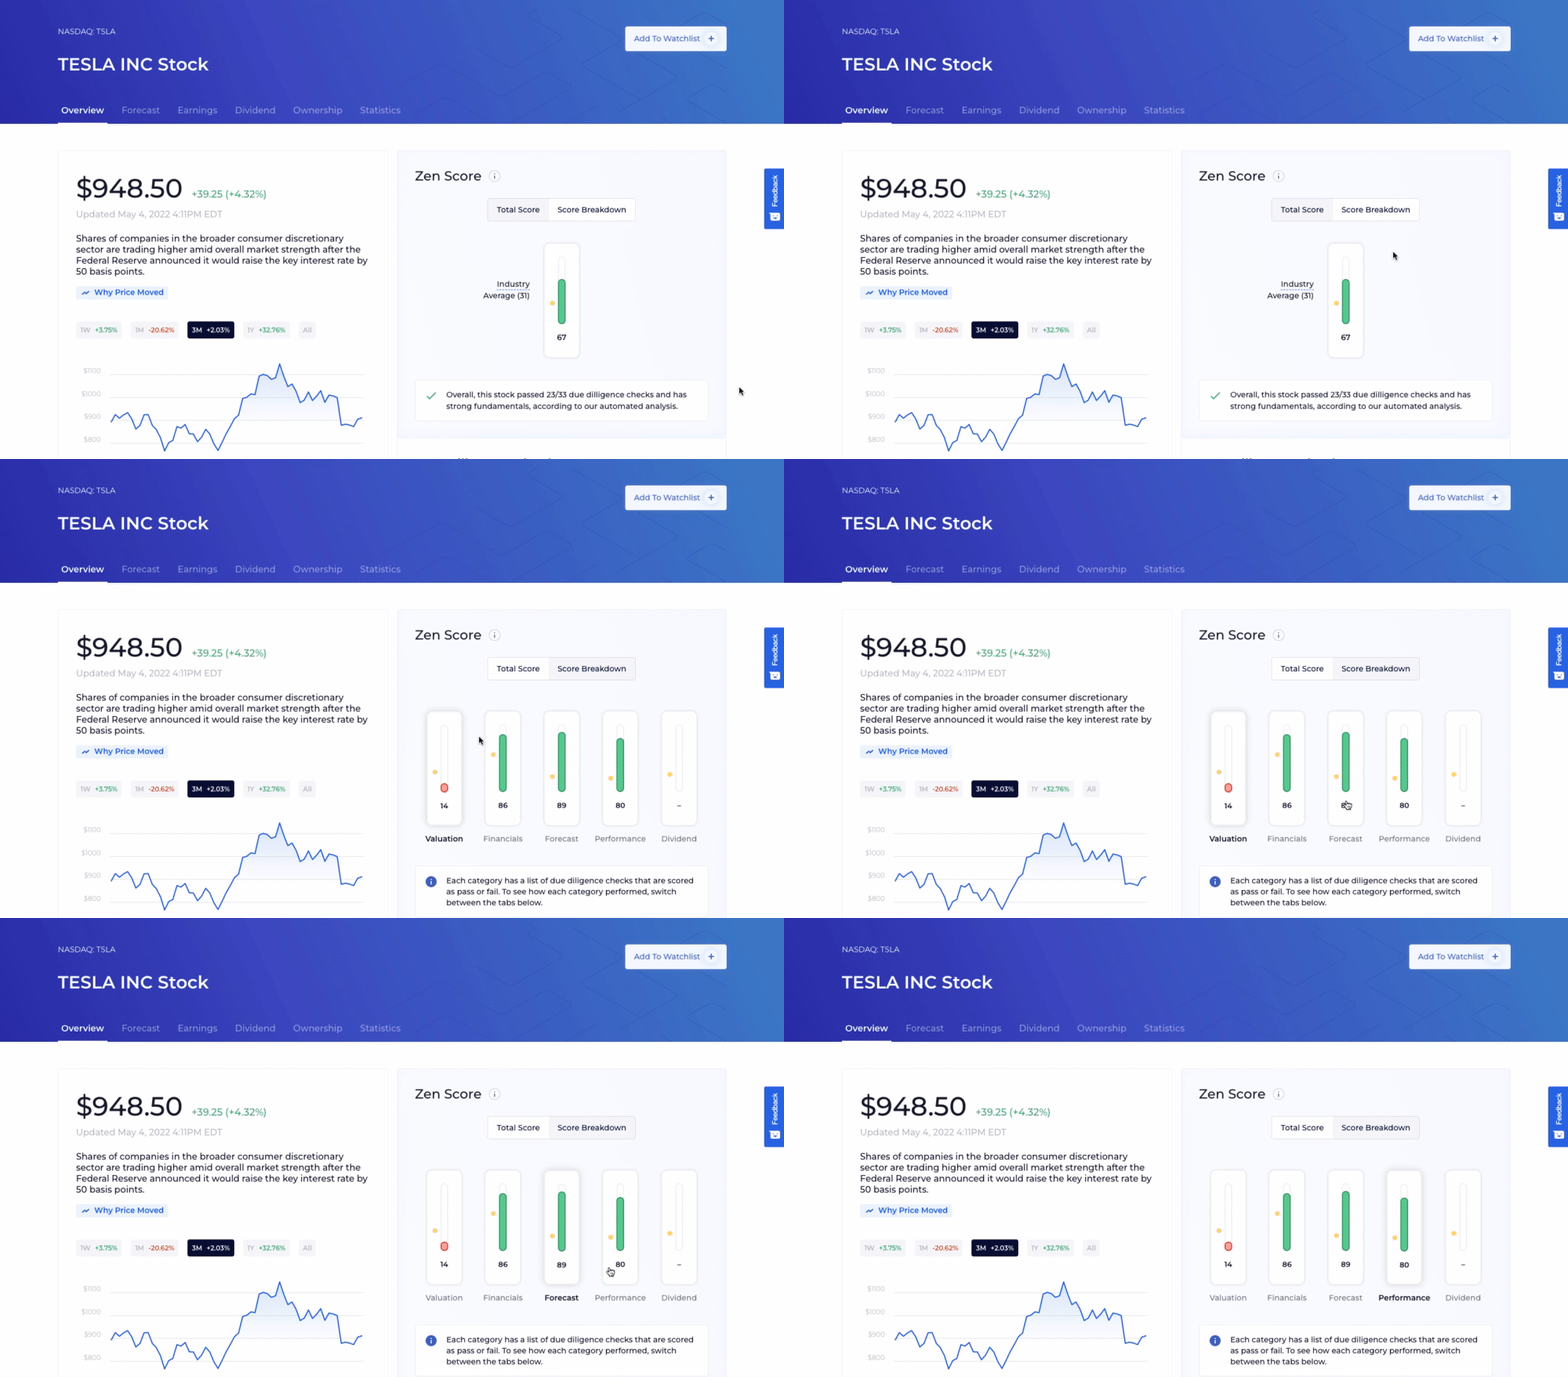
For high growth companies, like Tesla, we might expect a low Valuation score and a high Forecast score, and probably a good Performance score as well. Because of the company’s growth prospects, more people are willing to pay a high price for it today, which will drive its stock price up and therefore may hurt its Valuation score.
If we contrast that with a non-growth company, like First Bancorp, the Valuation score will look much better, but there’s not as much future upside. We would also expect the Forecast and Performance data to not look great, but the Financials and Dividend could look solid:
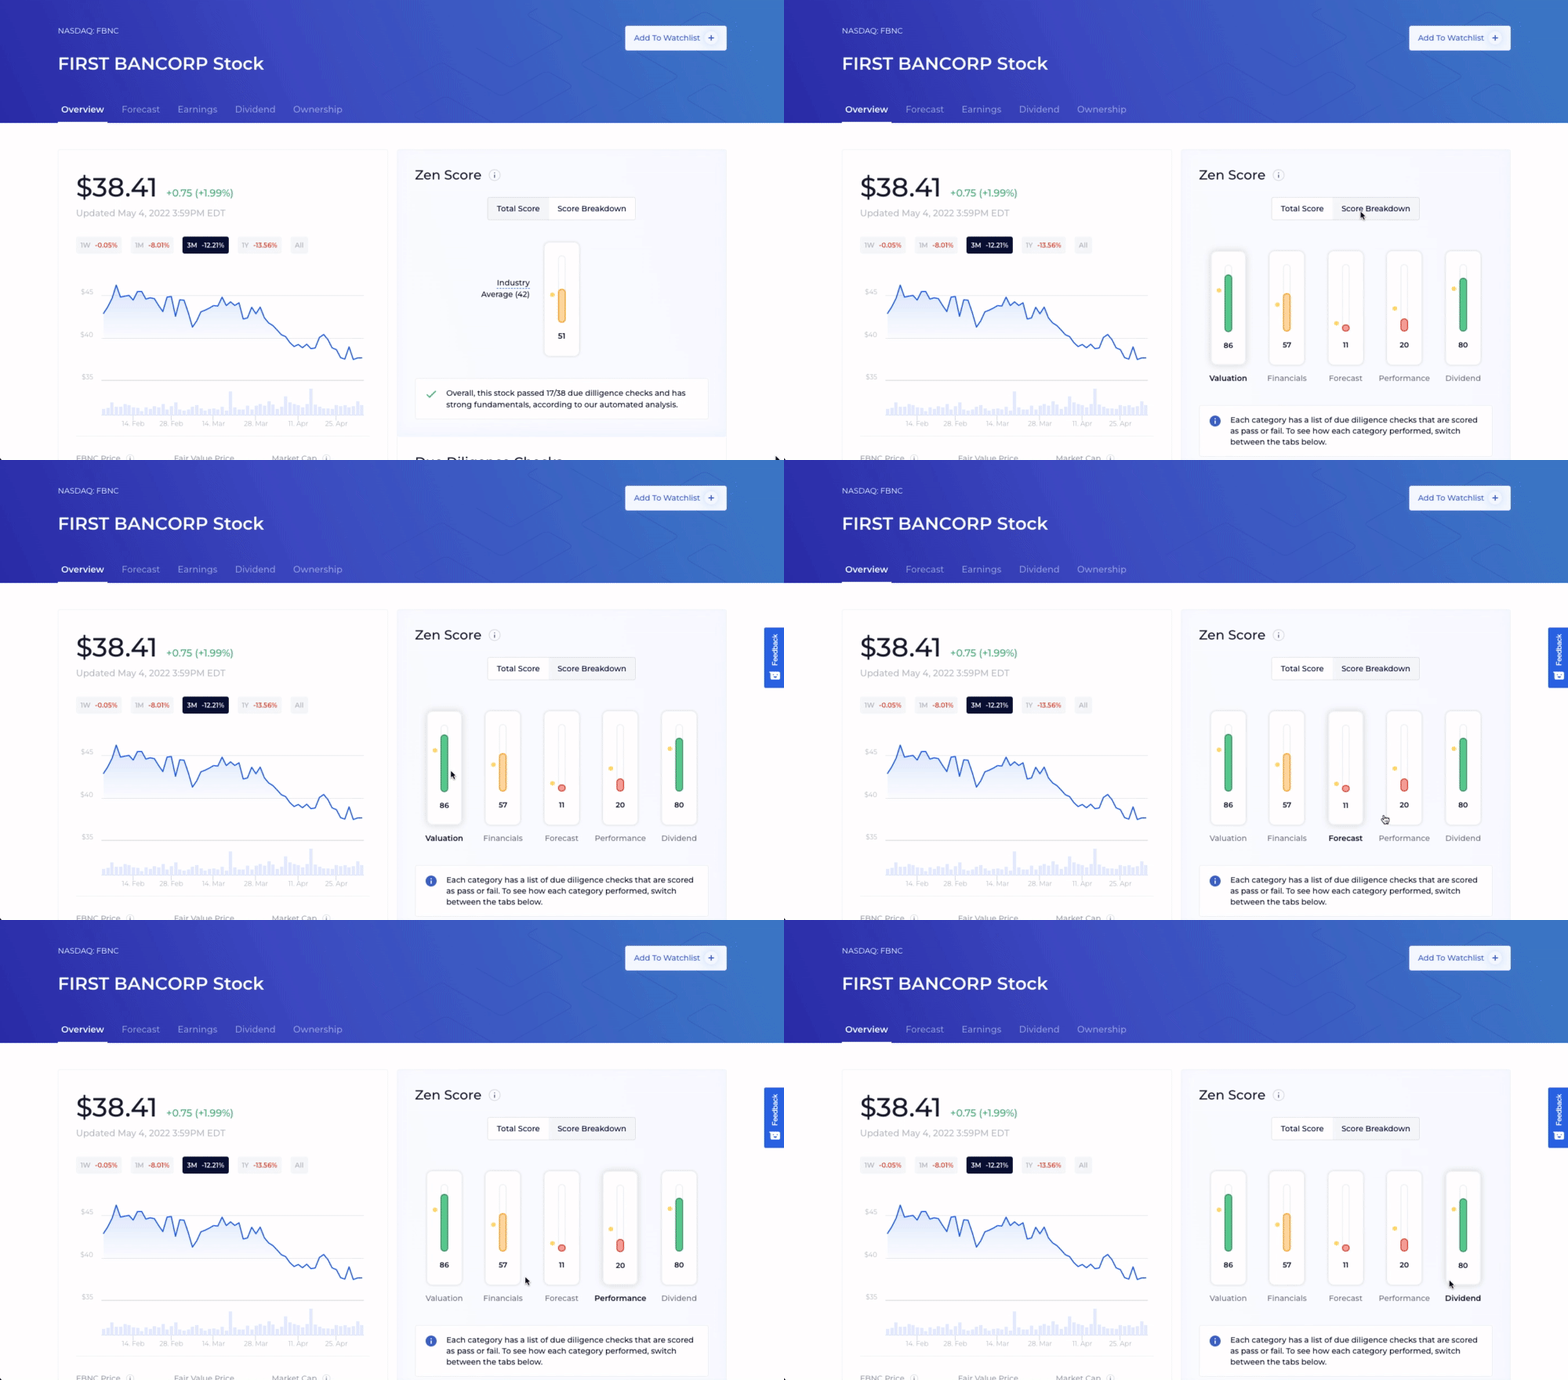
You can think of it like this: Many companies may appear to have the Valuation dimension to be on one side of a teeter-totter with the Forecast and Performance dimensions on the other end, tilting back and forth.
Similarly, companies with strong Financials will tend to have stronger Dividend scores because they’re more likely to be well-established, blue-chip type companies like General Mills.
Hopefully, you’re starting to see how each of these dimensions is related to the others, particularly how Valuation is connected to the other 4, and how getting context for each score is critical.
Valuation
Let’s head to Live Nation’s Valuation dimension now, where I’m anxious to uncover why it’s scoring 0.
The Valuation score is made up of a mix of relative valuation ratios and 3 based on intrinsic valuation.
Live Nation is failing all 7 Valuation checks because it is unprofitable and currently has a negative book value, which we can confirm by looking at the P/E and P/B ratios here on the side:
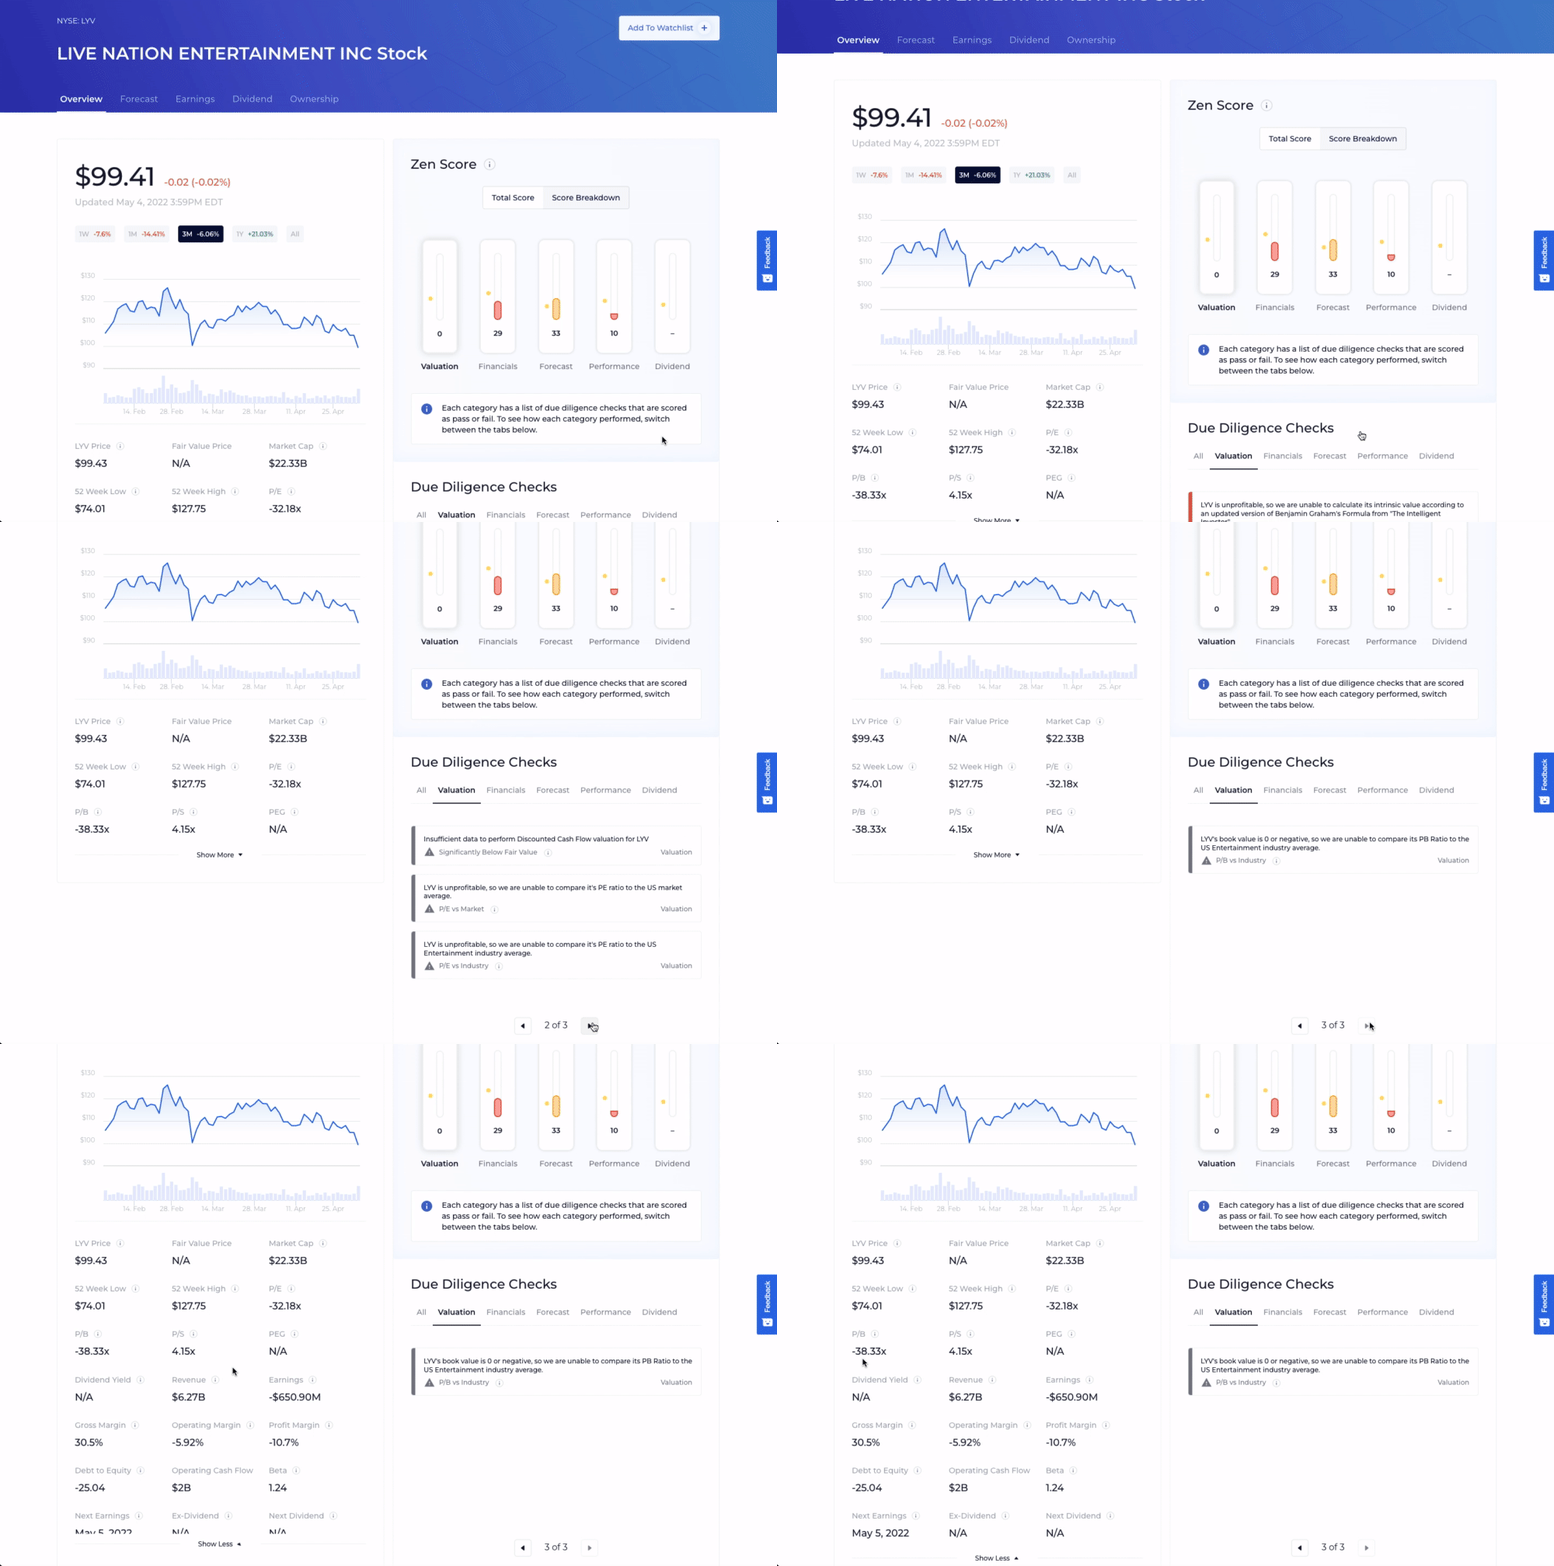
Most of our relative and intrinsic valuation checks rely on the company being profitable in order to pass. Negative book value just means the company has more liabilities than assets, and a lack of profitability means expenses are higher than revenue - neither of these necessarily mean the stock is a bad investment or is overvalued, but they both are pretty good indicators of the company's financial condition.
The Valuation score is 0/7 * 100 = 0
Financials
On to the Financials. When scanning through a company’s income statement, balance sheet, and statement of cash flows, there’s a few key things experienced investors look for: Assets vs liabilities, debt load, profitability, margins, operating cash flow, and new stock issuance are a few examples. We’ve summarized the primary ones into our automated checks:
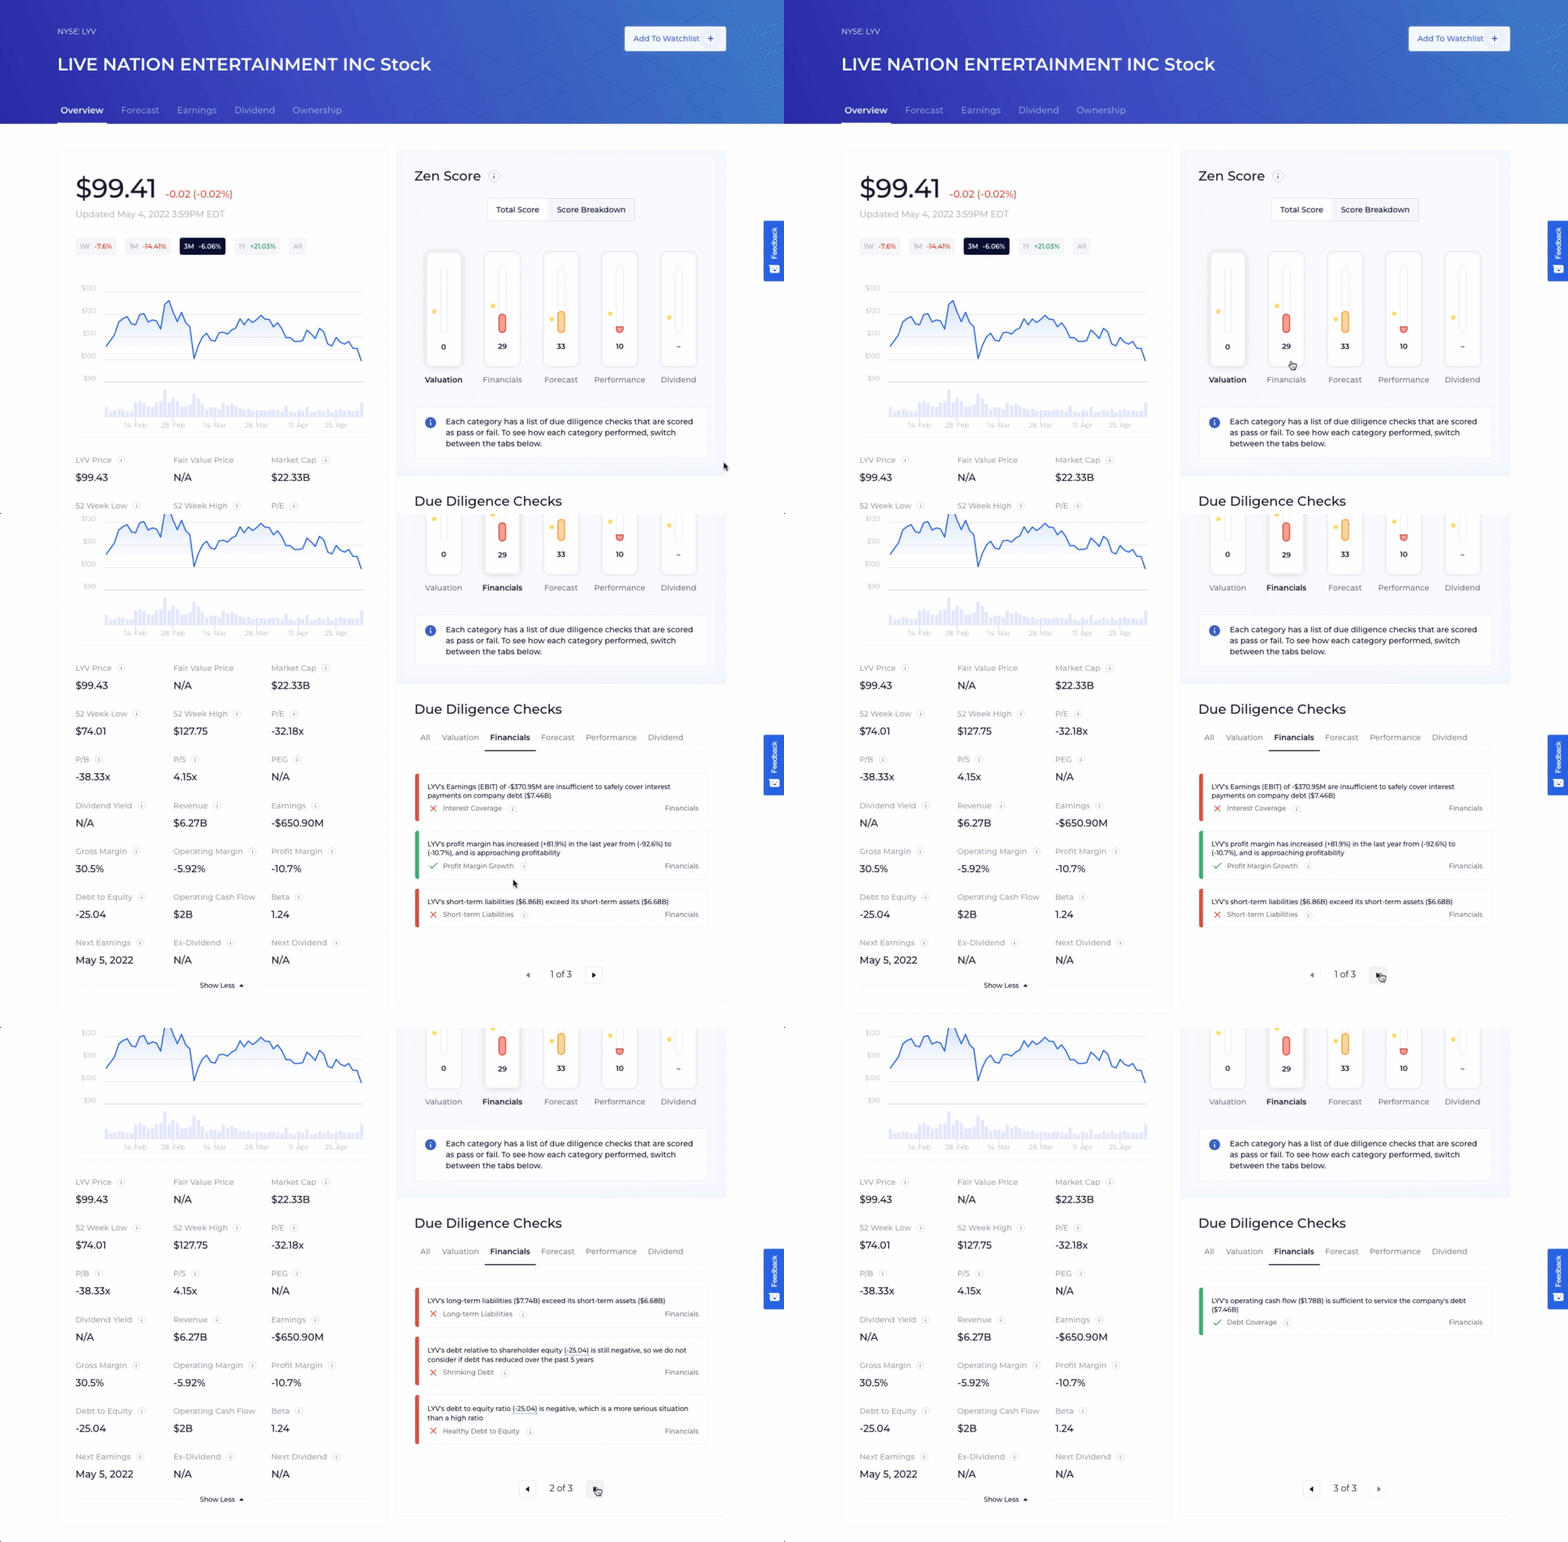
It looks like large liability and debt balances are causing Live Nation to fail 5 of 7 checks, passing just the profit margin growth and debt coverage. Wow, that profit margin jumped 82% in 2021 - I’m sure we’ll see that appear again soon.
The Financials score is 2/7 * 100 = 29
Forecast
The Forecast dimension is built off analyst projections, which we can see more in-depth on the Forecast page:
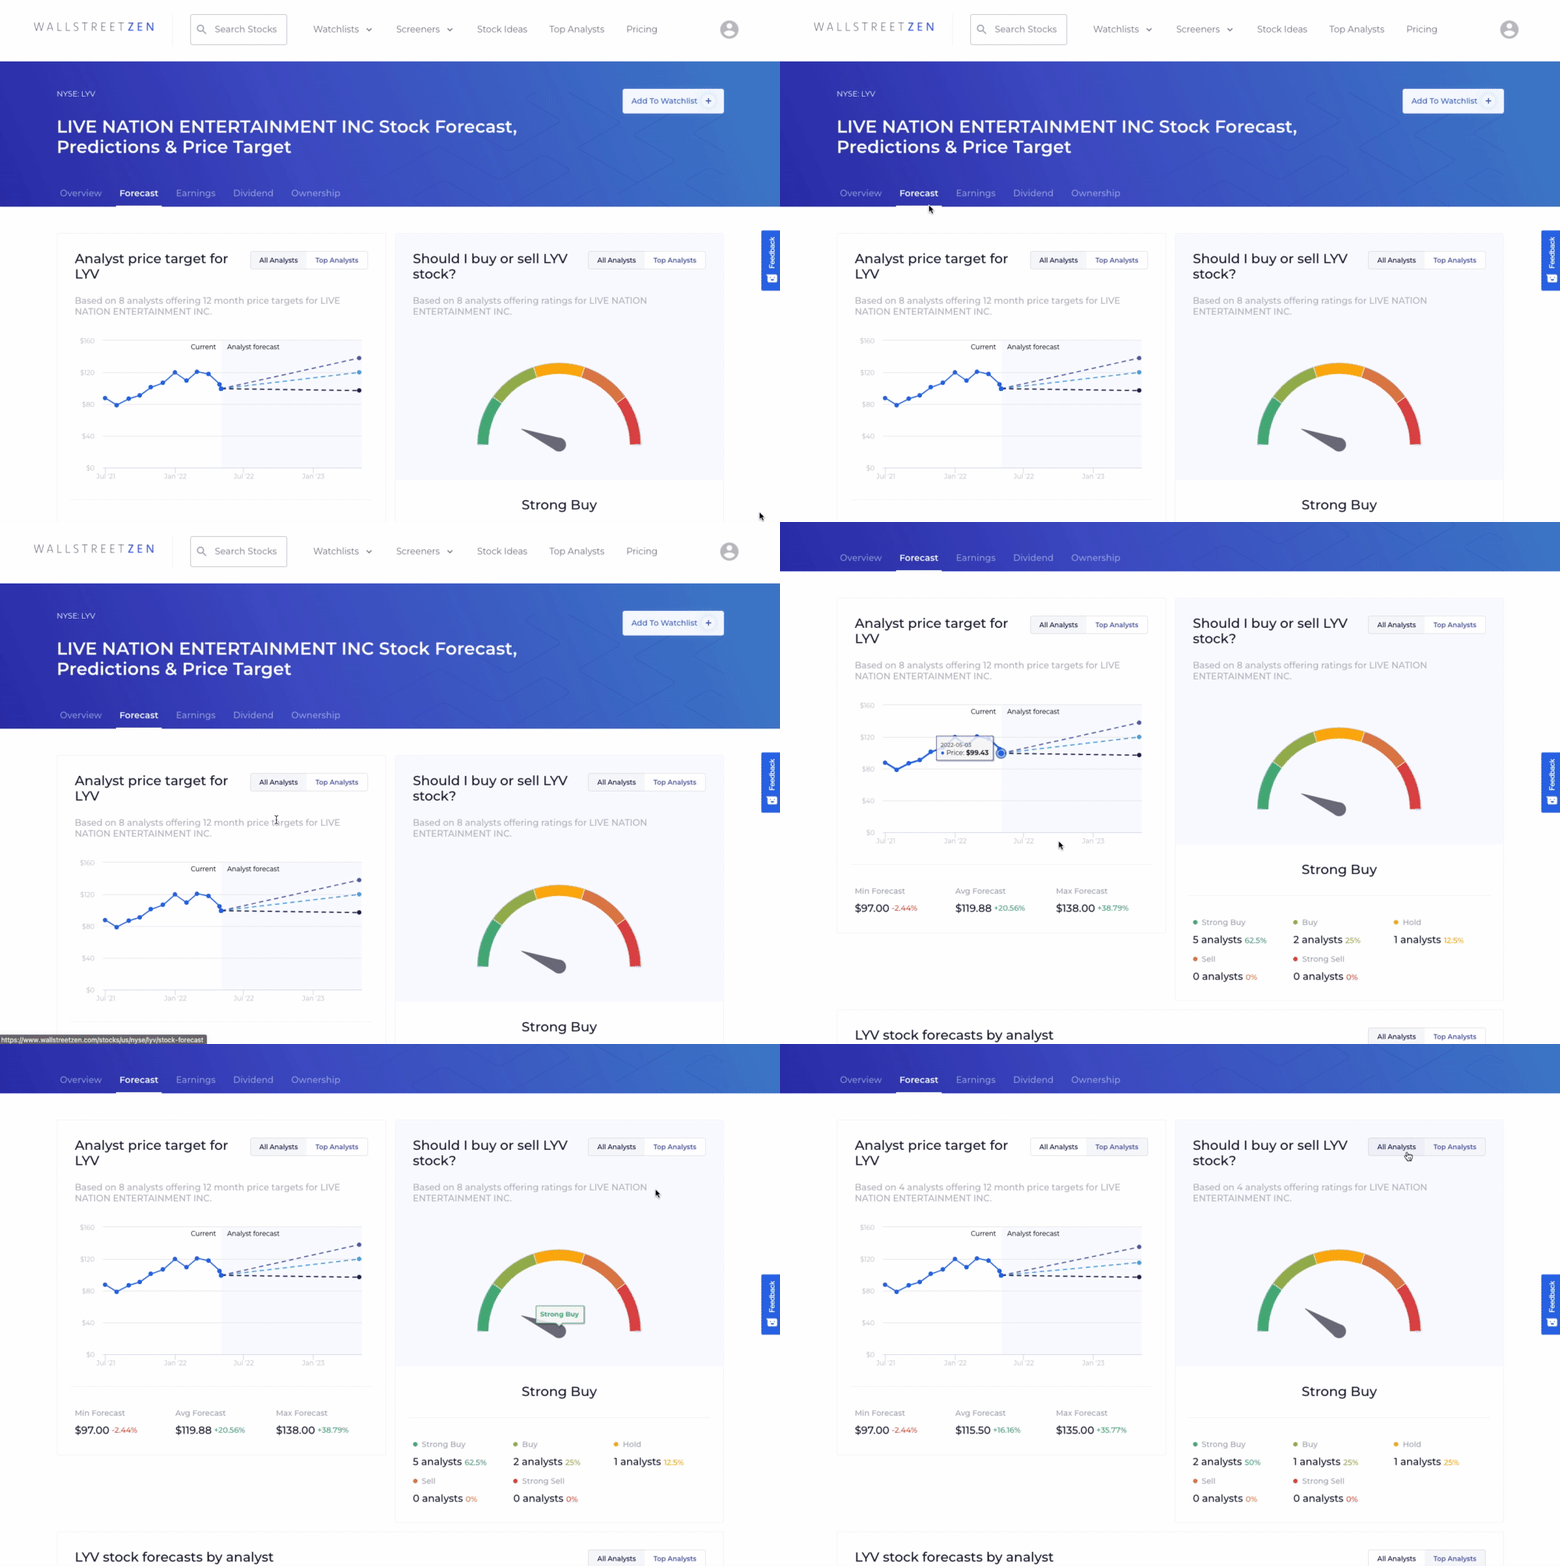
Interestingly, the analysts offering ratings have a consensus estimate of Strong Buy, while Due Diligence Score is painting a much more bearish picture.
We've broken down this "contradiction" more in-depth in this article here.
Despite the Strong Buy rating, Live Nation is still passing just 3 of 9 checks, for a score of 33.
Performance
The Performance dimension tracks a stock's revenue and earnings growth against itself, its industry, and its market as a whole, as well as a few other popular metrics like return on assets, return on equity, and return on capital.
For Live Nation, revenue growth, return on assets, and return on capital have been dismal, and we’ve already noted Live Nation’s lack of profitability:
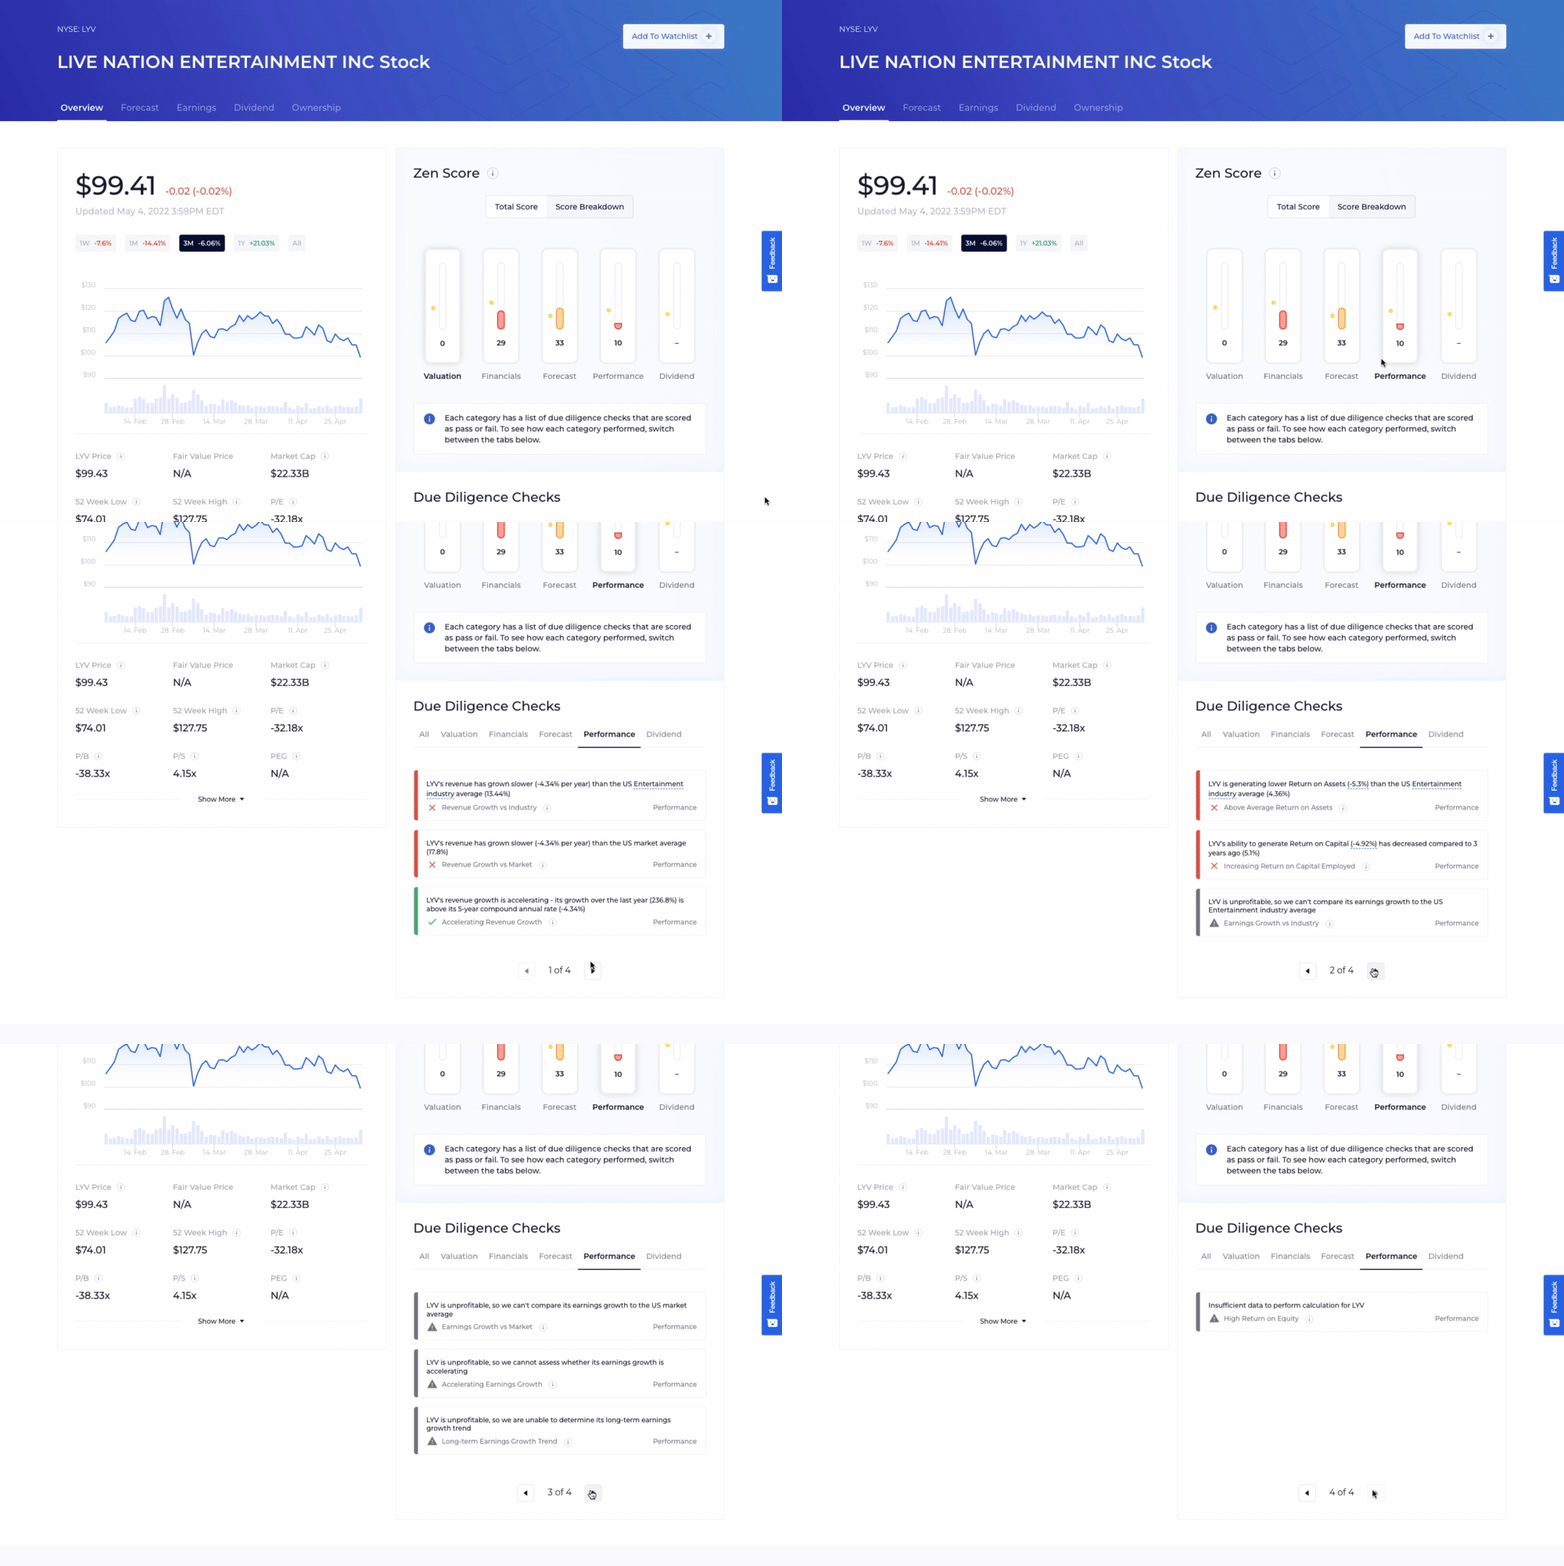
That explains its score of 10, passing just 1 of 10 checks.
We need to take that score with a grain of salt though, given what we know about the pandemic’s impact on the business. If the analysts’ forecasts prove to be right, the Performance score should be increasing in the near future.
If you want to learn more about how we track analyst performance and their historical projections, check out our Top Analyst video on YouTube or read about it in the article here.
Dividend
Finally, the Dividend dimension reveals that the company hasn’t issued any dividends in the last 10 years, so that section is left out of the final calculations for this company.
Final Takeaways
To recap, Live Nation scored a 0 for Valuation, 29 for Financials, 33 for Forecast, 10 for Performance, and we ignore the Dividend dimension for non-dividend-payers.
Add it all up for a total of 72, which is divided across the 4 dimensions we used in our calculation and we come to a total Due Diligence Score of 18.
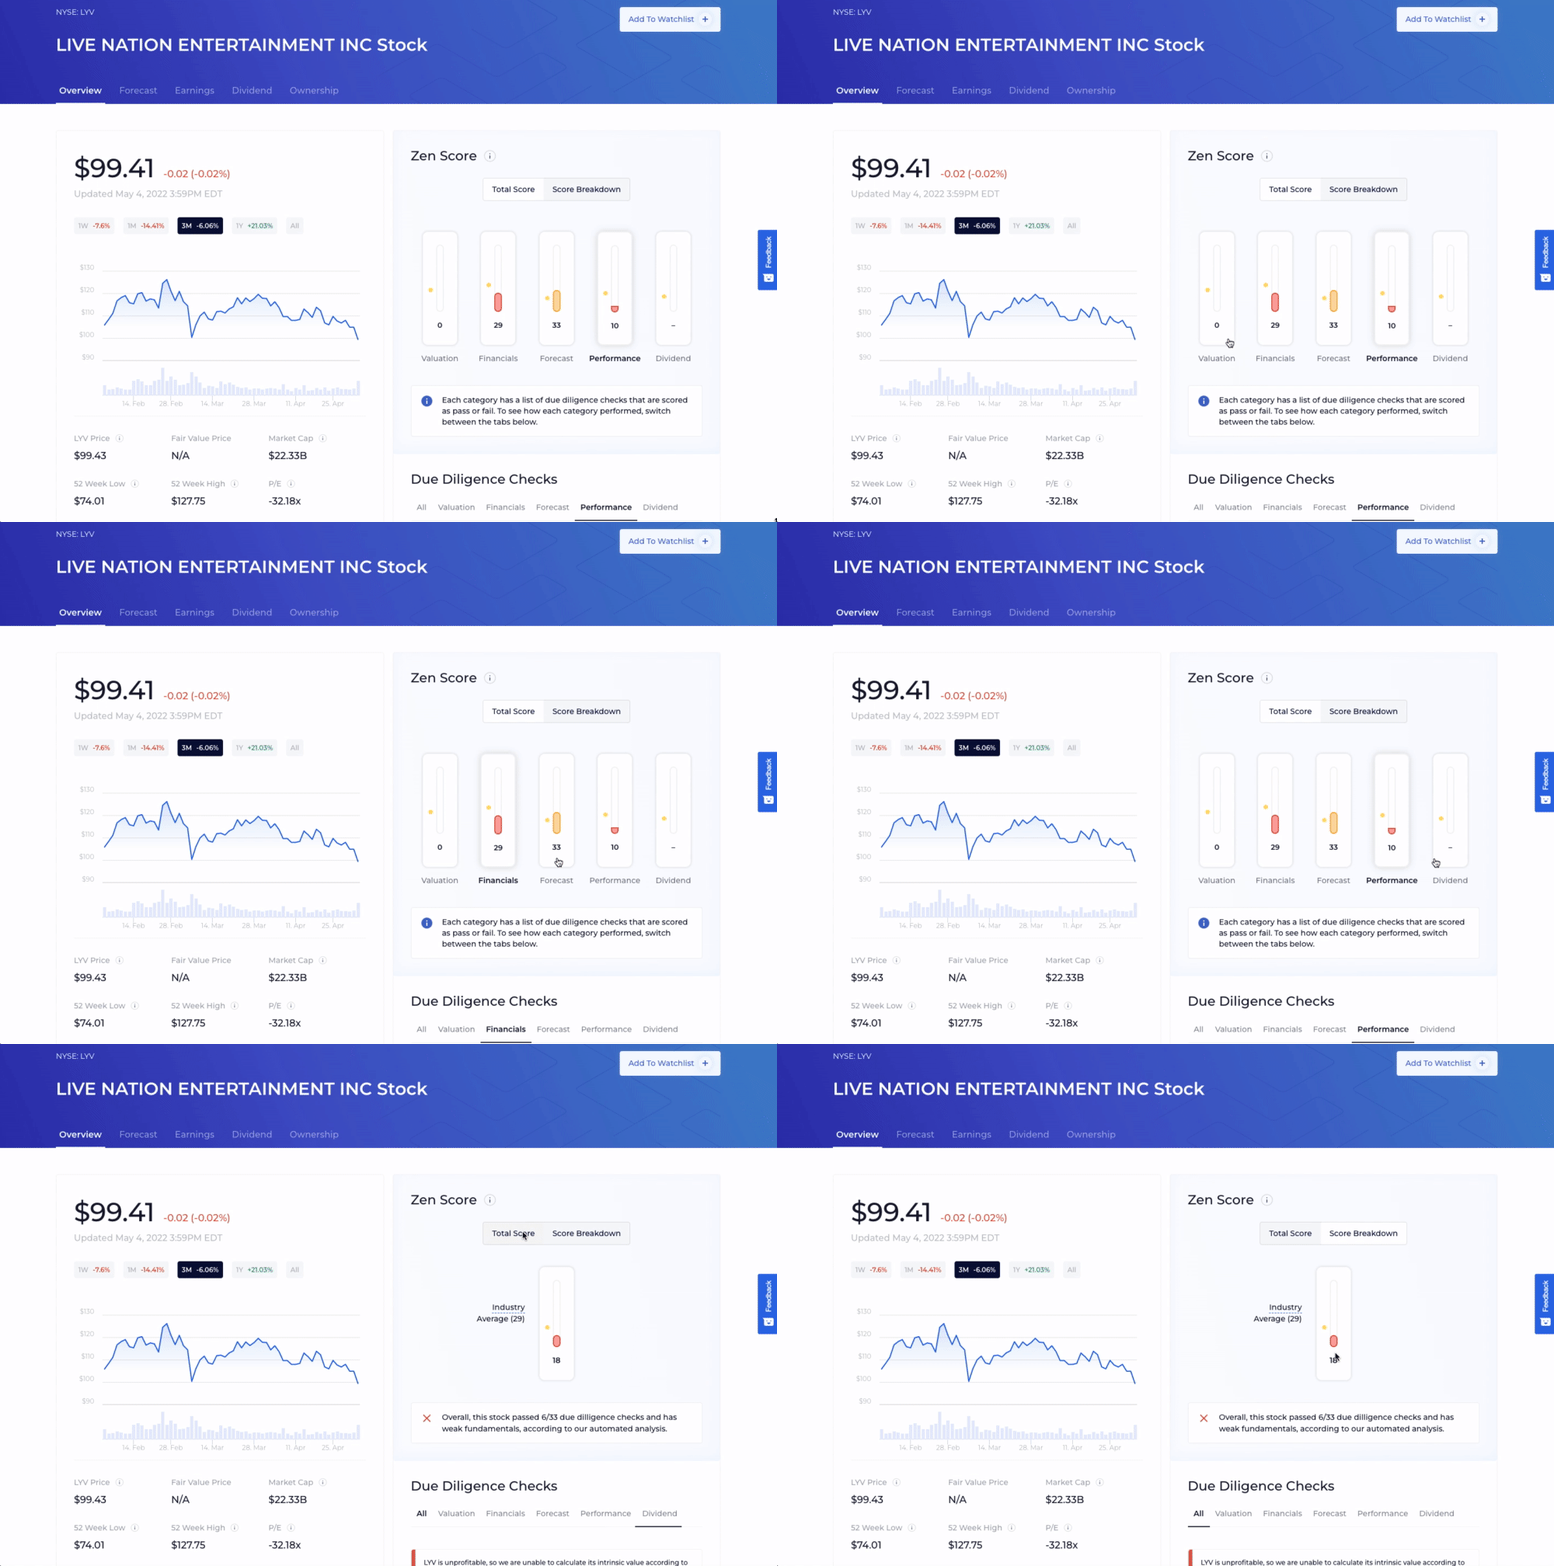
This poor score does not mean Live Nation should not be bought. If you agree with the analysts’ forecasts and believe in the COVID bounce-back of the company, you may decide to buy it anyway. But, if you do, you may be hesitant based on the low Due Diligence Score, and choose to only buy a few shares until the fundamentals improve.
Remember, the Due Diligence Score and the accompanying dimensions are meant to give you a quick pulse on the company, from where you can begin to build a narrative and inform a buy/sell decision.
