How are Due Diligence Scores calculated and how often are they updated?
 Updated
by Lincoln Olson
The Due Diligence Score can help you quickly understand the fundamental strengths and weaknesses of a stock in minutes.
We've taken time-tested fundamental analysis and used software to automate the process into easily digestible results and single-line explanations.
How Due Diligence Scores are calculated:
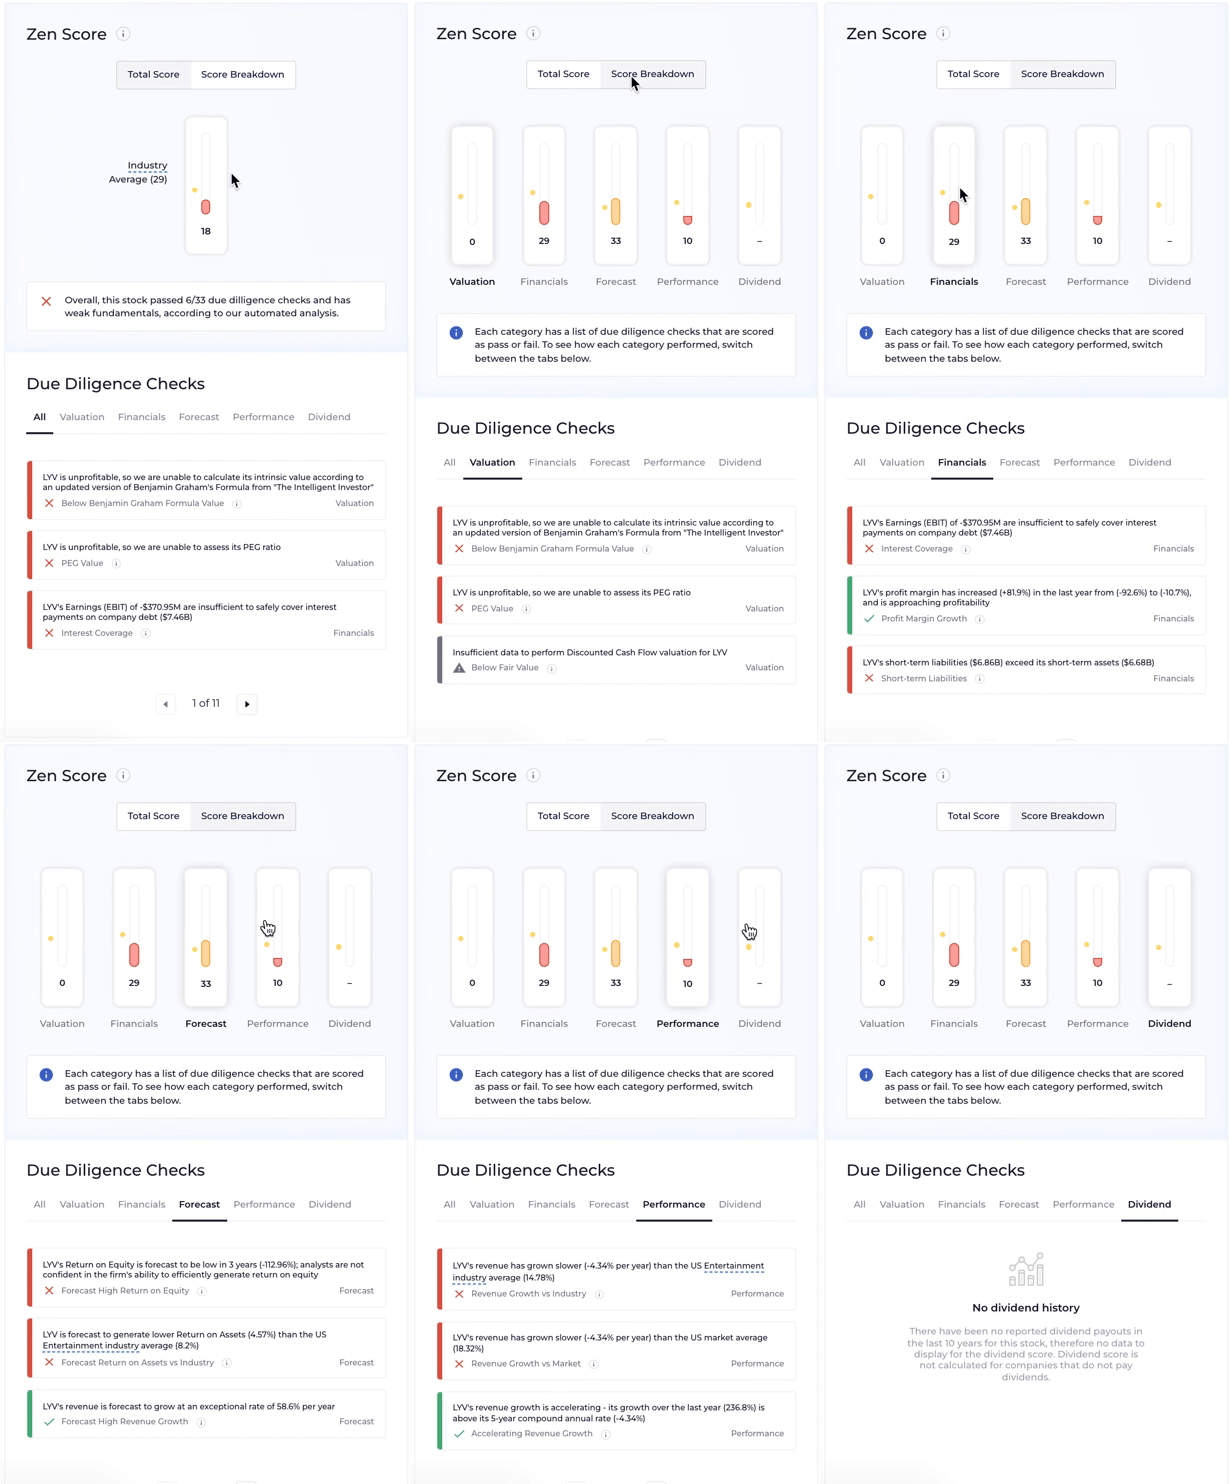
The single Due Diligence Score gives you an overview of a stock's fundamentals based on multiple due diligence checks run across 5 dimensions:

- Valuation – we compare the current stock price to its intrinsic value, using a number of time-tested stock valuation methods
- Financials – we analyze the company’s financial strength (or weaknesses)
- Forecast – we apply analyst estimates of future growth to key metrics and benchmarks
- Performance – we analyze the past performance of the company
- Dividends – we examine the stability and growth potential of the company’s dividends.
For each dimension, we run between 5-10 due diligence checks.
If a stock passes a due diligence check, we give it a 1. If it fails, we give it a 0. Then, for each dimension, we add up all the 1s and divided by the total number of checks within that dimension and multiply by 100.
For example, since there are 7 Valuation checks, if a stock passed 5 of those, then we would score it: 5/7 * 100 = 71 for Valuation.
The Total Due Diligence Score is then calculated by taking the average score from the 5 dimensions, providing you a single figure which represents the holistic view of the stock's fundamentals.
For example, let's look at Apple:

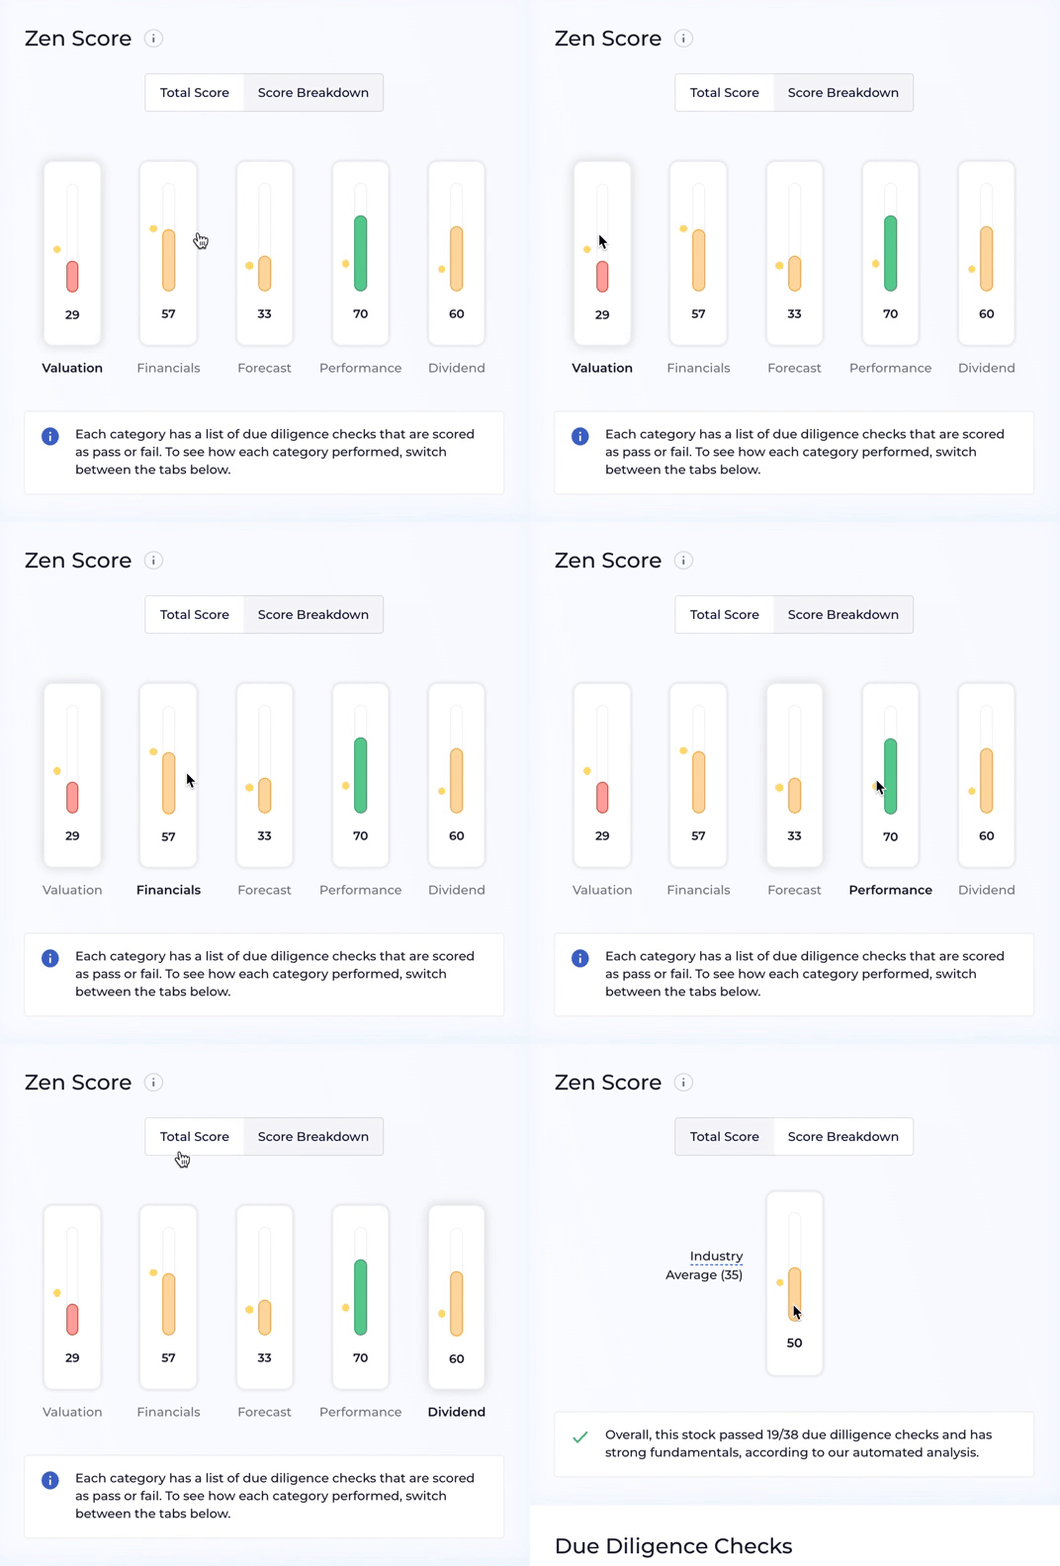
AAPL is scoring 29 for Valuation, 57 for Financials, 33 for Forecast, 70 for Performance, and 60 for Dividend.
29+57+33+70+60 = 249 / 5 = a Due Diligence Score of 50
For an even more detailed look on how we calculate the Due Diligence Score, click here.
How often Due Diligence Scores are updated:
Since the Total Due Diligence Score is a composite based on the 5 dimensions, some data updates daily while some data only updates quarterly.
For example, the Valuation and Performance dimensions use the stock's current price (which fluctuates daily) in their analyses, while the inputs for the Financials and Dividend dimensions are typically only reported quarterly.
In a category of its own, the Forecast dimension is heavily reliant on analyst estimates, predictions, and recommendations, which come out on varying schedules.
So then, Due Diligence Scores may update daily, but not every input used to calculate the Due Diligence Score should be expected to change that frequently.
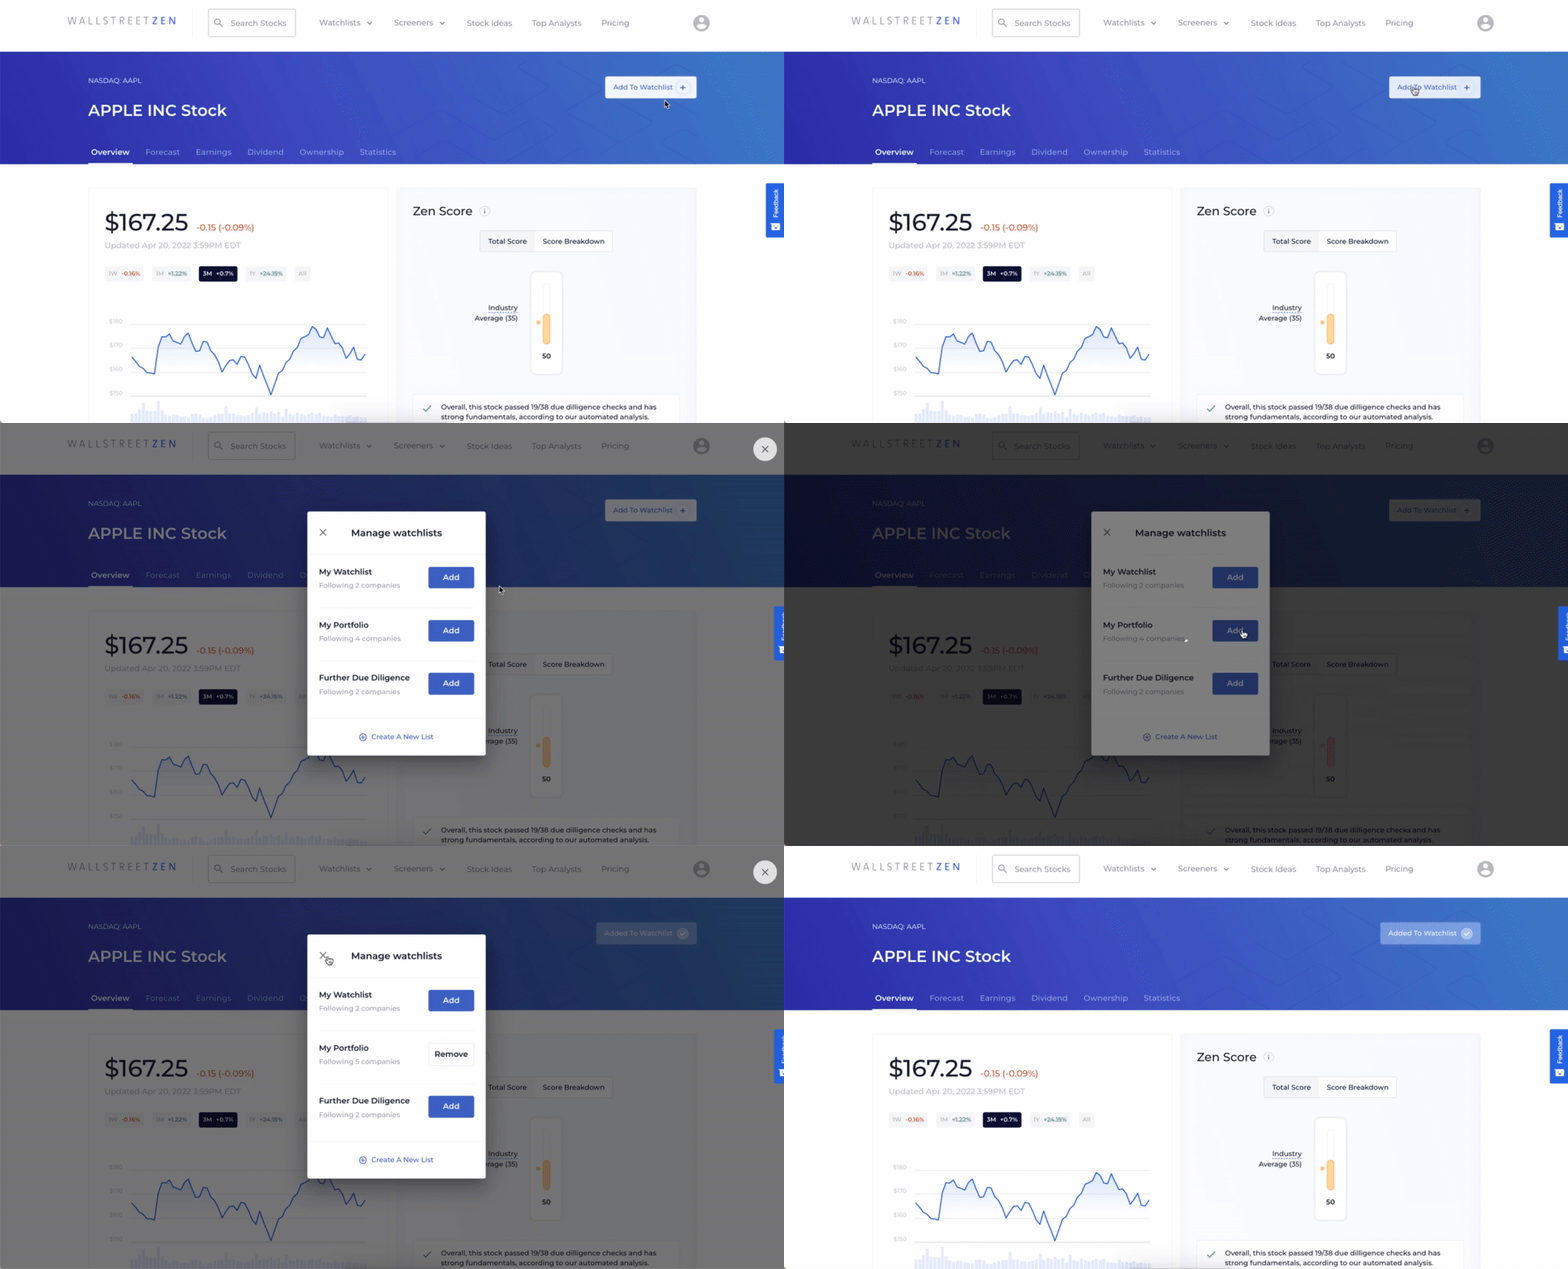
Another reason to add your favorite stocks to your watchlist:

To learn more about Due Diligence Score
Read about it on our blog: How the Due Diligence Score Automates Fundamental Analysis Checks
Or watch this video on YouTube: This Stock Research Hack Can Save You Hours of Painful Analysis
